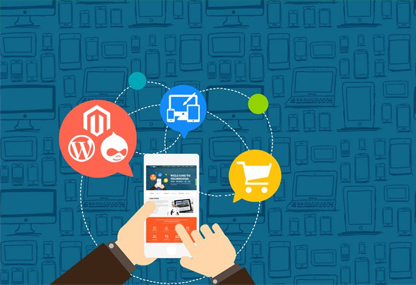
Business Intelligence process is a powerful technology, and today there’s more of information available than ever to help secure your competitive edge. So how do you cut through to the choice data that’s of most use ? Whether internal or for clients. Since you’re here, you probably know that data visualization technology (dashboards with charts, maps and drilldowns) will modernize your reporting process.
Bring out your artistic side and easily create beautiful dashboards that will engage your business users. Show off your brand by incorporating company logos, images and videos, or create a unique theme per dashboard. With limitless colors and charts styles to choose from, your imagination is your only limitation.
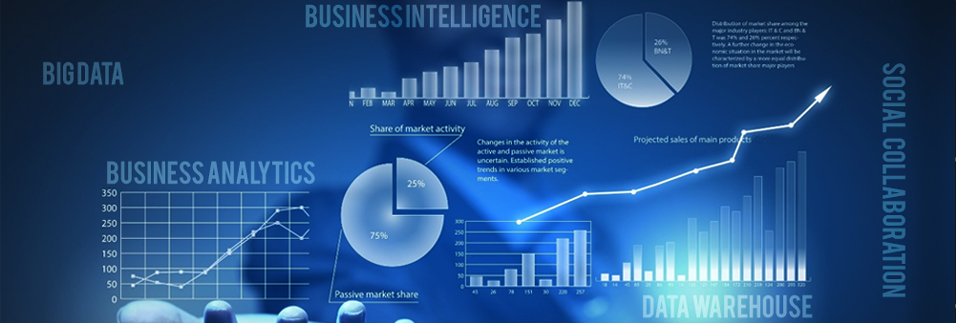
Monitor operations, sales and finance within organization with real time data reporting on powerful dashboard. With centralized metrics for financial and operational business, KPIs can be monitored and reported using key data points. Insights, notes, and narratives can be easily shared and meaningful decisions can be made with a macro business view on the customized dashboard.
Dashboards combines large data sets into a single repository with beautiful visualizations–all with no scripting. Explore your data sets, visualize trends and patterns, build professional dashboards and dig deep into your data using the most intuitive user interface in the market. Whatever your requirement is, Microsys provides you a unique experience when it comes to working with data.

Phone :+91-7800770666
Mobile :+91-7007469386
Email : microsys-technologies@hotmail.com
Microsys Technologies.
Near Canara Bank Retail Branch,
Deoria By Pass Road, Buddh Vihar
Taramandal, Gorakhpur, (U.P.)
India, Pin-273001